Introduction
Bill Williams is an American trader and author known for inventing popular trading indicators like the Alligator, Fractals, and Awesome Oscillator. The Alligator indicator helps traders identify trends and entry points at the beginning of price momentum. Traders often combine the Alligator with other technical indicators like Fractals and Awesome Oscillator for better results. The Alligator works on various markets and timeframes, with the best results seen on daily, four-hour, and one-hour timeframes. It is a valuable tool for trend recognition and trade entry timing, especially when used in combination with other technical indicators like Fractals and Awesome Oscillator for better results.
His contribution to trading involves following key rules such as always using a trading plan, treating trading like a business, using technology to advantage, protecting trading capital, becoming a student of the markets, risking only what can be afforded to lose, and developing a methodology based on facts. These rules emphasize the importance of risk management, continuous learning, and a disciplined approach to trading.
Bill Williams is a renowned trader and author who developed the Alligator indicator as part of his Chaos Theory, which emphasizes understanding market psychology and using indicators to identify trends and potential entry points. His unique approach to trading emphasizes the importance of understanding market psychology and using indicators like the Alligator to identify trends and potential entry points. Traders all over the world have widely adopted his strategies.
Brief Overview and Its Purpose
It consists of three moving averages that represent the jaw, teeth, and lips of the Alligator. When these lines are intertwined, it indicates a weak trend, and when they are moving in the same direction, it signals a potential trend. Traders can use the Alligator to make informed trading decisions by analyzing support and resistance levels, confirming trend reversals, and identifying potential entry and exit points. It is important to note that the Alligator should be used in conjunction with other technical analysis tools for effective trading strategies.
The purpose of the Alligator indicator is to define the market trend and generate entry points at the beginning of the price momentum. This enables traders to identify trends and entry points early, giving them a competitive edge through timely decision-making and maximizing profits. To determine potential entry and exit points in forex trading, Bill Williams created the indicator.
Market Trends and It’s Assistance
It can provide valuable insights for traders looking to capitalize on the direction of the market. By understanding market trends and utilizing tools like the Alligator indicator, traders can make more informed decisions and potentially increase their chances of success in the market. Keeping an eye on market trends can help traders anticipate potential resistance levels and trend reversals, allowing them to stay ahead of the curve when it comes to making profitable trades.
Who is Bill Williams?
Bill Williams is a well-known trader, author, and educator with over 50 years of trading experience in several markets. He is known for his views on trading psychology, chaos theory, and applied technical analysis. Bill Williams is widely regarded as a pioneer in the field of trading and has significantly contributed to the understanding and development of successful trading strategies.
He developed popular indicators such as the Awesome Oscillator, the Alligator Indicator, and the Market Facilitation Index. These indicators are part of his trading system and can be applied to various markets like Forex and the stock market.
Bill Williams was the founder of the Profitunity Trading Group and was considered the forefather of modern trading psychology combined with applied technical analysis and chaos theory in trading the stock and commodity markets.
He authored several best-selling books on trading concepts. His most famous book, “Trading Chaos: Maximize Profits with Proven Technical Techniques,” is still widely read and referenced in the trading community today. His work has had a lasting impact on the way traders approach markets.
What is the Alligator Indicator?
Components Alligator Indicator
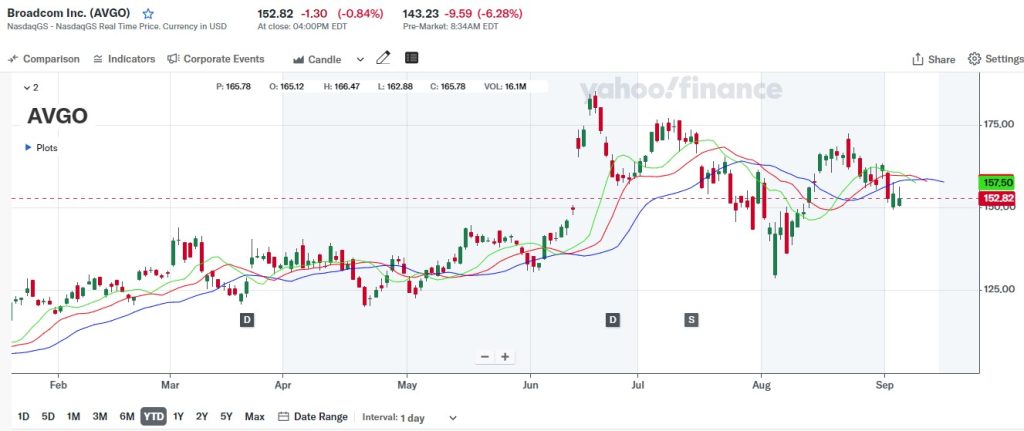
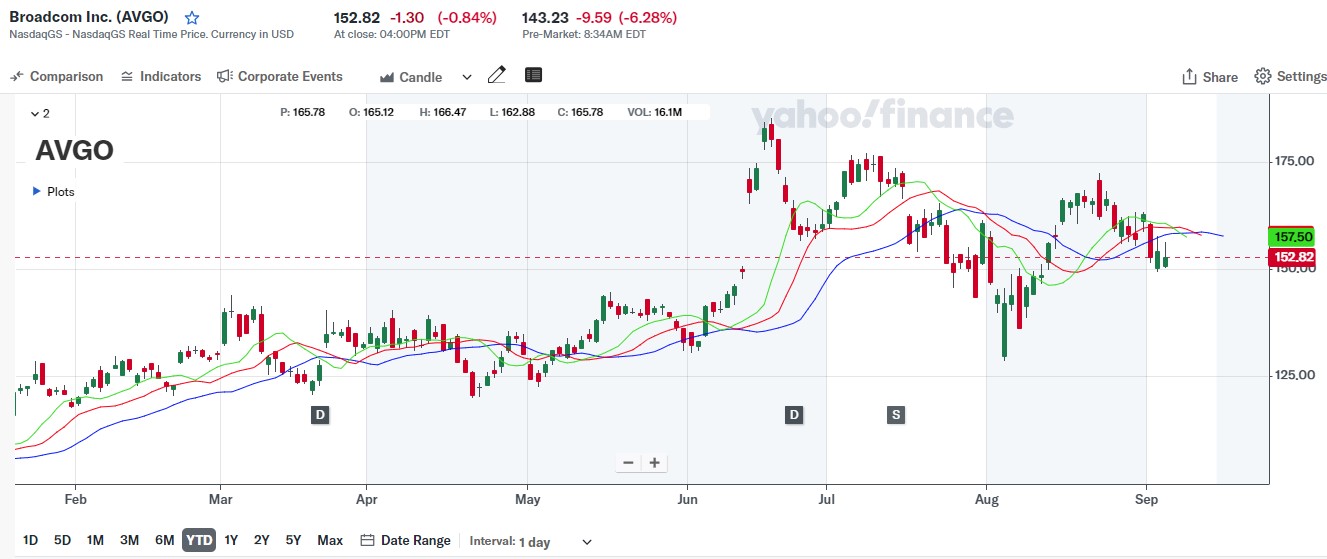
The Alligator Indicator consists of three moving averages: the Jaw Line (Blue), the Teeth Line (Red), and the Lips Line (Green). These lines represent different periods and colors, and their interactions can signal market trends and potential entry points. Traders can utilize the Alligator Indicator to determine stop-loss levels and recognize support and resistance levels for making trading decisions. The Alligator Indicator can be applied to various financial markets, including stocks, forex, commodities, and cryptocurrencies, to analyze trends and make informed trading decisions.
Jaw (Blue Line): 13-period Smoothed Moving Average
The 13-bar SMMA in the Williams Alligator indicator serves as the Jaw (Blue Line), and eight bars smooth it on subsequent values. It is part of the three moving averages that make up the Alligator indicator, along with the Teeth and the Lips. The Jaw is used to analyze market trends and trading ranges. The Jaw is typically used to determine the direction of the trend and potential entry or exit points for trades.
Teeth (Red Line): 8-period Smoothed Moving Average
The Teeth (red line) in the Alligator indicator is an 8-period smoothed moving average offset by 5 periods into the future, helping to identify trends and trading opportunities. The Teeth line serves as an average strength support/resistance level for entering trades when the trend is not very strong. The red line is the strongest level among the three lines in the indicator.
Lips (Green Line): 5-period Smoothed Moving Average
The Lips (green line) in the Alligator indicator is a 5-period Smoothed Moving Average that is offset by 3 periods into the future. It quickly responds to price changes and is employed to increase positions in a strong momentum trend. The green line is the weakest level among the three lines in the indicator.
Visualization

How Does the Alligator Indicator Work?
Distinguishing Between Trending and Ranging Markets
The Alligator indicator incorporates the concept of market phases, distinguishing between trending and ranging markets. During trending markets, the green line (Lips) swiftly responds to price changes and is utilized to enhance positions in strong momentum scenarios. This visual representation helps traders identify when to enter or exit trades based on the current market phase. In ranging markets, the green line (Lips) moves slower and is used to confirm support and resistance levels.
Sleeps and Awakens
During ranging markets, the Alligator indicator “sleeps” as the three lines are intertwined, indicating a lack of clear direction and potential consolidation. On the other hand, when the market enters a trending phase, the Alligator “awakens” with the lines spreading apart, signaling a potential strong trend in either direction. Traders can use these signals to adjust their strategies accordingly and capitalize on market movements.
Sleeping Phase
During the sleeping phase, the Alligator’s three lines are tightly intertwined and move horizontally in close proximity to each other, indicating low volatility and indecision in the market. Traders should exercise caution and avoid significant trading decisions during this phase, as breakouts or trend reversals are less likely to occur.
Awakening Phase
The Awakening phase of the Alligator Indicator occurs when the Alligator’s lines start to spread apart, indicating that the market is waking up from its consolidation phase and volatility is increasing. This spreading of the lines suggests potential trend developments and breakout opportunities.
Identifying Trends
When the lines are intertwined, it suggests consolidation, while diverging lines indicate potential trends. However, it is important to note that the Alligator Indicator should be used in conjunction with other forms of analysis for more accurate predictions.
Trading Strategies with the Alligator Indicator
Strategy 1: Trend-Following
When the lines are intertwined, it indicates a weak trend, but when they open up and move in the same direction, it signals a strong trend. Traders can use the indicator for trend following and trend reversal strategies.
Entry and Exit Points in a Trending Phase
The Alligator Indicator helps identify entry and exit points in a trending market phase by analyzing the alignment and separation of its components—the Jaw, Teeth, and Lips. It provides signals for potential uptrends or downtrends based on the alignment and movements of its components, offering traders insights into market direction and potential entry points. The indicator is most effective during trending markets, confirming trend presence and direction. During range-bound markets, it serves as a cautionary tool, warning traders to be selective with trades. The Alligator can also indicate the conclusion of a dormant phase, suggesting a possible new trend. Strategies for trading with the Alligator include entering trades during the ‘awakening’ phase and riding the trend until signs of exhaustion or reversal.
Stop-Loss Placement and Risk Management
In the trending phase of the Alligator indicator, traders can consider placing a stop-loss order above the entry point, with the level chosen based on risk tolerance. The higher the stop-loss level, the higher the risk tolerance and vice versa. Additionally, traders can integrate the Alligator indicator with the Commodity Channel Index (CCI) for enhanced strategies, considering overbought and oversold conditions to complement the Alligator’s indications. It is important to enter trades in the direction of the trend and to use the Alligator indicator in conjunction with other technical indicators for confirmation of trend directions and increased reliability of trading decisions. Effective risk management techniques, such as setting appropriate stop-loss and take-profit levels based on market conditions and trade size, are crucial for successful trading as they help minimize losses and protect trading capital.
Strategy 2: Combining the Alligator with Other Indicators
Using with RSI, MACD, or Fibonacci Retracements
To use the Alligator indicator with RSI, MACD, or Fibonacci retracements, you can combine the Alligator Indicator with RSI to identify trend direction and strength, with MACD to confirm momentum shifts, and with Fibonacci retracement levels to find potential entry and exit points within the trend. For example, if the Alligator shows a bullish trend and RSI is above 70, it might signal an overbought condition. When both the Alligator and MACD align, it can provide a strong signal. Fibonacci retracement levels can be used in conjunction with the Alligator to find potential pullback levels in an uptrend. Exit trades when the Alligator’s lines start to converge, indicating the end of the trend. Combining the Alligator with other indicators like RSI, MACD, or Fibonacci retracement can help confirm signals and reduce false positives.
Strategy 3: Alligator and Breakouts
Spotting Potential Breakout Opportunities
To spot potential breakout opportunities using the Alligator indicator, traders can look for signals such as diverging lines indicating the alligator getting hungry, which anticipates a market breakout. They can also consider entering or exiting positions when the lines converge or cross and integrate the indicator with other tools like the Commodity Channel Index for enhanced analysis. By using multiple indicators together, traders can better anticipate market movements and make more informed trading decisions.
Pros and Cons
Pros:
Easy to Understand and Implement
One of the pros of using the Alligator indicator is that it is easy to understand and implement. It can help traders identify potential breakout opportunities by looking for signals like diverging lines, indicating the alligator is getting hungry. It can also be used to determine entry and exit points when the lines converge or cross.
Works Well in Trending Markets
The Alligator indicator works particularly well in trending markets, where it can accurately identify potential breakout points and help traders make informed decisions. It can be a valuable asset for traders looking to capitalize on trending market conditions.
Can be used in Conjunction with Other Indicators
Through the integration of this indicator with others, traders can enhance their likelihood of success by obtaining a thorough examination of the market conditions. This can help traders make more informed decisions and potentially maximize their profits.
Cons:
Not as Effective in Sideways or Choppy Markets
During sideways or choppy markets, this indicator may not provide reliable signals as it thrives in trending market conditions. Traders should be cautious when using it during these periods and consider combining it with other indicators for a more comprehensive analysis.
May Produce False Signals in Low-Volatility Conditions
In low-volatility conditions, traders should be wary of potential false signals generated by this indicator. To mitigate the risk of making poor trading decisions, it is advisable to seek confirmation from other indicators or market analysis tools.
Practical Tips
Best Timeframes to use for Day Trading, Swing Trading, etc.
For day trading, the best timeframes are typically one-minute to 15-minute charts, while swing traders may prefer 30-minute to four-hour charts. Longer timeframes on charts are more appropriate for investors with long-term goals.
Position traders, on the other hand, may find the indicator effective on weekly charts. Position traders, aiming for longer-term positions, find weekly charts ideal as they offer a broader perspective on market trends and align well with the Alligator indicator’s signals over extended periods.
It is important to use the indicator in conjunction with other tools to confirm signals and manage trades effectively.
Importance of Backtesting Your Strategy
Backtesting your trading strategy with the alligator indicator is important for evaluating historical performance, refining strategies, and building confidence. This enables traders to evaluate risks, identify patterns, and test their strategies under various conditions, enhancing their readiness for uncertainties and refining their trading approaches. It also helps traders identify patterns and trends that may not be immediately visible.
Conclusion
In conclusion, utilizing tools such as the Alligator indicator is essential for traders looking to improve their performance, refine their strategies, and build confidence in their decision-making process. By analyzing historical performance and identifying trends early on, traders can effectively manage risks and optimize their trading strategies for better outcomes. In essence, the Alligator indicator is a valuable tool for traders aiming to anticipate market trends and make informed decisions for enhanced success.
Traders can simulate real trading scenarios in a demo account to gain proficiency in interpreting the Alligator indicator’s signals and honing their decision-making abilities before transitioning to live trading. This hands-on approach allows traders to test different strategies and become more familiar with the indicator’s capabilities before risking real money in live trading. Through practice and perseverance, traders can effectively incorporate the Alligator indicator into their trading routine and leverage its insights to improve their overall performance in the market.
This powerful tool can help identify potential entry and exit points, as well as signals for trend reversals. Integrating the Alligator into their trading approach can enhance traders’ performance and boost their success opportunities in the market. With practice and dedication, utilizing the Alligator indicator can lead to more profitable trades and better overall trading outcomes.
References
Alligator – Forex Trading Strategy, Alligator Indicator. (n.d.). Alligator – Forex trading strategy, Alligator indicator. Retrieved September 5, 2024, from https://www.xchief.com/library/indicators/alligator/
Alligator Indicator | ChartSchool. (n.d.). Alligator Indicator | ChartSchool. Retrieved September 5, 2024, from https://chartschool.stockcharts.com/table-of-contents/technical-indicators-and-overlays/technical-indicators/alligator-indicator
Alligator. (n.d.). TT Help Library. Retrieved September 5, 2024, from https://library.tradingtechnologies.com/trade/chrt-ti-alligator.html
Bill Williams Indicators — Technical Indicators — Education — TradingView. (240 C.E., January 1). TradingView. Retrieved September 5, 2024, from https://www.tradingview.com/education/billwilliams/
Bill Williams – Profitunity: A Holistic Approach to Trading. (n.d.). Bill Williams – Profitunity: A holistic approach to trading. Retrieved September 5, 2024, from https://profitunity.com/bill-williams/
Bill Williams (Trader) – Wikipedia. (n.d.). Bill Williams (trader) – Wikipedia. Retrieved September 5, 2024, from https://en.wikipedia.org/wiki/Bill_Williams_(trader)
https://trendspider.com/learning-center/what-is-the-williams-alligator-indicator/. (n.d.). Retrieved September 5, 2024, from https://trendspider.com/learning-center/what-is-the-williams-alligator-indicator/
https://www.markets.com/education-centre/what-is-the-williams-alligator-indicator/. (n.d.). Retrieved September 5, 2024, from https://www.markets.com/education-centre/what-is-the-williams-alligator-indicator/
https://www.morpher.com/blog/alligator-indicator. (n.d.). Retrieved September 5, 2024, from https://www.morpher.com/blog/alligator-indicator
L. (2023, January 4). Alligator Indicator Explained – What Is the Williams Alligator Indicator? | LiteFinance. LiteFinance. Retrieved September 5, 2024, from https://www.litefinance.org/blog/for-beginners/best-technical-indicators/alligator-indicator/
markets, I. (n.d.). Bill Williams Alligator | Williams Alligator Strategy | Alligator Indicator Formula | IFCM. Bill Williams Alligator | Williams Alligator Strategy | Alligator Indicator Formula | IFCM. Retrieved September 5, 2024, from https://www.ifcmarkets.com/en/ntx-indicators/alligator
Master How to Use Alligator Indicator in Forex Trading. (2024, February 22). PIP Penguin. Retrieved September 5, 2024, from https://pippenguin.net/forex/learn-forex/alligator-indicator-in-forex/
Mukherjee, S. (2024, February 24). Decoding the Alligator Indicator in Forex Trading: Strategies, Signals, and Success Stories. Medium. Retrieved September 5, 2024, from https://medium.com/@snehankanmukherjeework/decoding-the-alligator-indicator-in-forex-trading-strategies-signals-and-success-stories-877219badf9b
Teeth, Jaws and Lips: How to Trade With the Alligator Indicator | Real Trading. (2023, May 31). Real Trading. Retrieved September 5, 2024, from https://realtrading.com/trading-blog/william-alligator-indicator/
Top 10 Rules for Successful Trading. (2024, June 3). Investopedia. Retrieved September 5, 2024, from https://www.investopedia.com/articles/trading/10/top-ten-rules-for-trading.asp
Welcome to Our Support Portal. (n.d.). Welcome to our Support Portal. Retrieved September 5, 2024, from https://www.instaforex.com/support/en/article/73/
What Is the Alligator Indicator and How Do You Use It in Forex Trading? (n.d.). IG. Retrieved September 5, 2024, from https://www.ig.com/en/trading-strategies/what-is-the-alligator-indicator-and-how-do-you-use-it-in-forex-t-210412
What Is the Williams Alligator Indicator and How Do You Trade With It? (2024, July 30). Investopedia. Retrieved September 5, 2024, from https://www.investopedia.com/articles/trading/072115/exploring-williams-alligator-indicator.asp
What Is the Williams Alligator Indicator and How Does It Work? | FBS Broker. (2018, December 10). FBS. Retrieved September 5, 2024, from https://fbs.eu/en/analytics/guidebooks/alligator-indicator-255
Williams Alligator. (n.d.). TradingView. Retrieved September 5, 2024, from https://www.tradingview.com/support/solutions/43000592305-williams-alligator/


