Introduction
Brief Overview
Bollinger Bands, a popular tool among traders, offer valuable insights into market trends and price volatility. They consist of a simple moving average line and two standard deviation lines above and below it, creating a channel that prices typically move within. Traders use it to identify when prices are too high or too low.
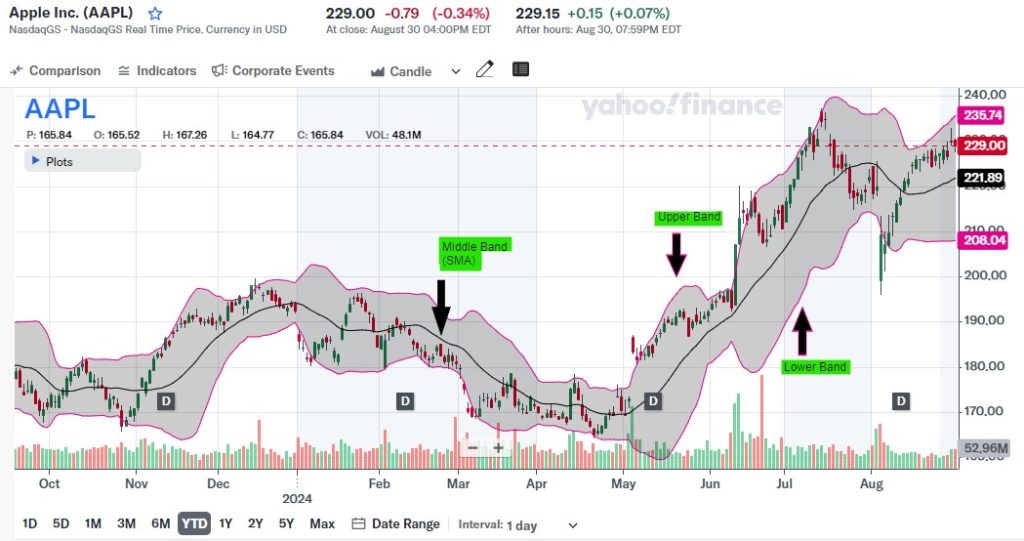
It is a technical analysis tool used to determine where prices are high and low relative to each other. These bands consist of three lines: a simple moving average (the middle band) and an upper and lower band. The bands widen and narrow as the volatility of the underlying asset changes.
Bollinger Bands, created by John Bollinger, a prominent figure in technical analysis, in the 1980s, utilize a moving average and standard deviation to evaluate stock price volatility and trends. Traders utilize it to gauge price volatility and pinpoint buy or sell signals for a wide range of financial assets and time frames. The bands are typically plotted two standard deviations away from the moving average.
How it is used in Technical Analysis
Traders use technical analysis to evaluate investments and find trading opportunities by analyzing price trends and patterns. It involves analyzing historical price data, volume, and other market indicators to make informed decisions about buying or selling assets. The goal of technical analysis is to forecast future price movements and maximize profits.
Traders often look for price breakouts when the bands widen, indicating increased volatility, and potential trend reversals when the bands contract. Combining Bollinger Bands with other indicators helps traders make better decisions on when to enter or exit the market. This approach allows traders to identify potential entry and exit points with greater precision, leading to more profitable trades.
Additionally, using it in conjunction with other technical tools can provide confirmation of signals and reduce the risk of false alarms. Overall, technical analysis using Bollinger Bands is a valuable tool for traders looking to capitalize on market trends and make strategic investment decisions. However, it is important to remember that no tool or strategy can guarantee success in the stock market. Technical analysis is a key component of a comprehensive trading strategy for traders. Technical analysis should be combined with fundamental analysis and risk management techniques. It is also crucial for traders to stay informed about market trends and news that may impact their investments. Staying informed will help traders make more informed decisions and adapt their strategies accordingly. This will ultimately lead to more successful and profitable trades.
How to use Bollinger Bands Effectively
Technical analysis is one area where knowing how to use Bollinger Bands effectively is very crucial. It serves as a valuable tool for traders to identify market trends, potential price breakouts, and detect overbought or oversold conditions. Traders can improve their accuracy in timing trades and raise their chances of making profitable decisions by becoming proficient with Bollinger Bands.
It can also be used in conjunction with other technical indicators to provide a more thorough analysis of the market, which can result in an all-around more successful trading strategy. Higher possible profits and better risk management may follow from this. To build wealth and ensure financial stability in the future, it is ultimately essential to increase the likelihood of long-term success in trading and to achieve financial goals through consistent and disciplined decision-making.
What are Bollinger Bands?

What is It and What are the Components of It
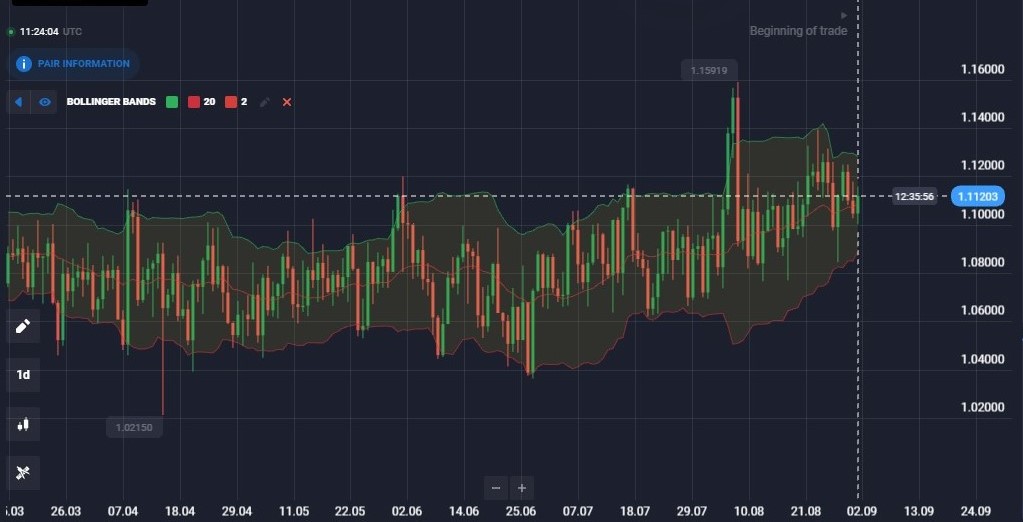
It is a tool used in technical analysis, comprising a simple moving average, an upper band, and a lower band. Similar to how financial advisors calculate their Bollinger Bands, this process involves adding and subtracting a standard deviation from the moving average. These bands are useful for traders to spot potential overbought or oversold conditions in the market, as well as potential trend reversals. During times of increased volatility, the bands expand, while they narrow during periods of decreased volatility.
Having a solid grasp of the components of Bollinger Bands is crucial for traders who want to make well-informed decisions in the market. Understanding the simple moving average, upper band, and lower band can give you valuable insights into possible price movements and market conditions. These components enable traders to evaluate levels of volatility and spot potential points for entering and exiting.
How They are Calculated
Bollinger Bands are calculated by utilizing a basic moving average and incorporating two standard deviations above and below the moving average. The upper band is determined by adding two standard deviations to the moving average, while the lower band is determined by subtracting two standard deviations from the moving average.
The simple moving average (SMA) plays a crucial role in the calculation of Bollinger Bands, working in tandem with the upper and lower bands. The simple moving average (SMA) plays a crucial role in minimizing the influence of price fluctuations within a specified timeframe, typically around 20 days. By integrating the SMA into the formula, traders can enhance their analysis of market trends and identify potential trading opportunities.
To calculate the standard deviation, you first need to find the mean of the data set. Then, subtract each value from the mean, square the result, calculate the mean of those squared differences, and finally, determine the square root of the mean. Next, you’ll want to subtract each value from the average, square the result, and calculate the mean of those squared differences. Lastly, calculate the square root of the mean to determine the standard deviation. Proficiency in calculating standard deviation enables traders to accurately establish the upper and lower bands in Bollinger Bands analysis, reflecting market volatility effectively.
Having a grasp on calculating standard deviation enables traders to skillfully establish upper and lower bands, offering valuable insights into price fluctuations and possible breakouts. The degree of standard deviation fluctuates based on the specific asset being analyzed and the overall market conditions. Usually, Bollinger Bands are set with two standard deviations above and below the 20-day simple moving average (SMA).
Standard deviation is a widely employed metric for evaluating the risk level linked to an investment. A higher standard deviation denotes greater volatility, which causes returns to be more unpredictable. On the other hand, a lower standard deviation implies lower volatility and more stable returns. Investors utilize standard deviation to assess and compare the levels of risk associated with various investments. This enables them to make well-informed decisions that align with their risk tolerance and investment goals. Diversification allows investors to mitigate the overall risk of their portfolio by blending investments with different standard deviations.
Interpretation of Bollinger Bands
It is a useful tool for investors to evaluate the volatility and potential risk of an investment by incorporating standard deviation into their analysis. The bands indicate the upper and lower bounds of price movement, with wider bands suggesting higher volatility and narrower bands suggesting lower volatility. Understanding how returns vary around the average helps investors make informed decisions and manage risks effectively using it.
How to use Bollinger Bands
Identifying Overbought and Oversold Conditions
An effective strategy involving Bollinger Bands is to recognize instances of overbought and oversold conditions. When the price of an asset reaches the upper band, it could be seen as overbought, suggesting a possible reversal or pullback in price. On the other hand, if the price reaches the lower band, it might indicate an oversold condition, which could present a potential opportunity to buy as the price may be undervalued. When the price hovers around the middle band, which is a 20-period simple average, it suggests that the price is currently going through a consolidation phase.
Spotting trend reversals
A shift in the direction of a dominant trend is referred to as a trend reversal. Paying attention to price movement around support and resistance levels can help identify trend reversals. A trend reversal might be suggested if an uptrend shows weakness near a resistance level or a downtrend weakens near a support level. It’s crucial to consider confirmation signals like candlestick patterns or chart patterns before making trades based on predictions of trend reversals.
Using technical indicators like the Moving Average Convergence Divergence (MACD) or the Relative Strength Index (RSI) can help identify trend reversals. If there is a bearish divergence on the MACD or RSI, it could suggest that there might be a potential trend reversal to the downside. On the other hand, a bullish divergence could be an indication of a reversal to the upside. It’s crucial to consider a variety of indicators and validate signals before making trading decisions centered around trend reversals. Not taking this step into consideration can result in inaccurate predictions and possible financial losses in the market.
Setting Stop-Loss and Take-Profit Levels
To control risk and safeguard your investment, you must establish stop-loss and take-profit levels when trading. Establishing a stop-loss level can reduce losses if a trade does not unfold as expected. Alternatively, a take-profit level allows you to secure your profits prior to any potential shifts in market conditions. Using risk management tools and analyzing trend reversals can help you make informed decisions for a higher chance of success in trading. Always remember the importance of setting stop-loss orders to limit potential losses.
Tips for using It effectively
Combine with other Technical Indicators for Confirmation
For optimal utilization of Bollinger Bands, it is advisable to complement them with additional technical indicators to ensure confirmation. By utilizing this tool, you can gain a deeper understanding of market conditions and potential trends. By combining it with indicators like the Relative Strength Index (RSI) or Moving Average Convergence Divergence (MACD), traders can enhance their decision-making and improve their trading outcomes. In addition, when traders use these indicators along with stop-loss and take-profit levels, they can effectively manage risk and safeguard their investments.
Use Different Time Frames for Analysis
When analyzing the market, it’s crucial to take into account various time frames in order to gain a more comprehensive understanding of market conditions. By analyzing different time frames, traders can gain a deeper understanding of the overall trend and potential price movements. Combining technical indicators like Bollinger Bands with other indicators like RSI or MACD can further improve the performance of this multi-time frame analysis. Bollinger Bands are one example of such an indicator. Traders can enhance their trading strategies and make better decisions with the aid of this thorough approach.
Practice with a Demo Account before Trading with Real Money
Prior to engaging in live trading, it is essential to hone your skills and understanding of the market by utilizing a demo account. Through the use of various time frames and technical indicators such as Bollinger Bands, RSI, and MACD, traders can enhance their strategies and make more informed trading choices. Using a demo account enables traders to experiment with various strategies without putting their actual money at stake. This helps them gain confidence and expertise before venturing into the real market.
Common Mistakes to Avoid
Over Relying on Bollinger Bands Alone
Avoid the common mistake of relying solely on Bollinger Bands for trading decisions. Using it in combination with other technical indicators and analysis methods can greatly enhance the accuracy of trading decisions. It is important to consider multiple factors when making well-informed investment choices. Through the utilization of a diverse range of tools and strategies, traders can effectively minimize the potential risks associated with making impulsive or erroneous trades solely relying on Bollinger Bands signals.
Ignoring Market Conditions and Sentiment
It is essential to consider market conditions and sentiment when utilizing this tool. It is important to consider multiple factors, such as market trends and investor sentiment, when using Bollinger Bands to analyze potential price movements. Through careful consideration of various indicators and analysis methods, traders can enhance their decision-making process and gain a deeper understanding of the overall market landscape. This approach can help prevent tunnel vision and avoid making trading decisions solely based on its signals.
Not Adjusting Settings for Different Securities or Time Frames
It is important to customize the settings of Bollinger Bands based on the specific security being analyzed and the time frame being used. This will ensure that traders are receiving the most accurate and relevant information to make well-informed decisions in the fast-paced world of trading.
For example, a trader may solely rely on Bollinger Bands to make trading decisions for a specific stock without considering the overall market conditions or sentiment. If external factors other than those that it indicates influence the stock’s price movements, this tunnel vision approach could result in missed opportunities or losses. To avoid this, traders should adjust their analysis methods and settings based on the security being traded and the time frame being considered to ensure a more holistic view of the market.
Conclusion
Recap of Key Points for using Bollinger Bands
In conclusion, it’s critical to keep in mind that there are other factors to take into account when using Bollinger Bands to guide trading decisions. Traders need to consider external market conditions and sentiment, adapt their analysis methods and settings accordingly, and maintain a comprehensive view of the market to avoid missing out on opportunities or incurring losses. By taking these factors into account, traders can enhance their decision-making and increase their chances of making profitable trades with it.
Importance of Practice and Experience in Mastering Bollinger Bands
Practice and experience are necessary to become proficient with this indicator. Through consistent utilization in different market conditions, traders can enhance their ability to interpret the signals given by the bands. Through practice, traders can refine their strategies and gain a deeper understanding of when to make adjustments for optimal performance. Through experience, traders can gain a comprehensive understanding of how Bollinger Bands behave in various situations, enabling them to make more informed and profitable trading choices. Ultimately, becoming proficient in it necessitates a commitment to honing your skills and a willingness to gain knowledge through hands-on experience.
Encouragement to Continue Learning and Improving Trading Skills
Always keep in mind that ongoing education and constant refinement are crucial for achieving success in trading. Face challenges with enthusiasm, stay curious, and keep learning for improvement. Through hard work and determination, one can gain expertise in Bollinger Bands and achieve greater confidence and success in trading. Strive to continuously expand your knowledge, develop your skills, and be flexible in your approach. Your dedication and effort will ultimately yield positive results.


